
It is much easier to express any numerical data table through Excel graphs and charts. But just putting a random graph will not be enough as you need to make sure that the graph is catchy and easy to understand. Changing the graph’s line thickness plays an important part in the process.
But if you don’t have the idea about how to change line thickness in Excel graph, you might suffer in the long run. That’s why you should learn the process as a newcomer in MS Excel or other office applications.
Table of Contents
- The Possible Reasons Why You May Need to Change the Line Thickness in Excel Graph
- How to Change Line Thickness in Excel Graph – The Step-by-Step to Follow
- How to Make a Line Graph in Excel
- Final Thoughts
The Possible Reasons Why You May Need to Change the Line Thickness in Excel Graph
In many cases, changing the graph thickness in MS Excel is crucial. You can either set the line thickness before applying or change the thickness later when required. The possible reasons that might force you to change the graph line thickness later are:
- When the graph line thickness doesn’t match with the context of the graph
- To make the graph line look pleasing to the viewer’s eyes and make those lines easily understandable for the viewers
How to Change Line Thickness in Excel Graph – The Step-by-Step to Follow
It is one of the easiest tasks in MS Excel, even for a beginner. But this easiest task can turn into a headache if you fail to apply the correct steps in the right period. For example, if you ask how to change the thickness of a line in word 2016 or other MS Office applications, the process always remains the same.
Now the steps to go through to get your job done are:
Step-1: Select the Line or Lines of the Graph
Before changing the thickness, you must decide which lines you should apply this thickness changing method. Sometimes, you may require to change the thickness of only a line to make things correct. Or you may even need to change the thickness of the whole set of graph lines to make it catchy and relatable.
So, you will have to select all the lines first that you want to change the thickness by either reducing or decreasing it. While working with only a line, clicking on that line once will complete the selection process. But if you have multiple lines to select for the task, the process is different.
In this case, you will have to select the first line and then press and hold the CTRL button from the keyboard to select all the desired lines.
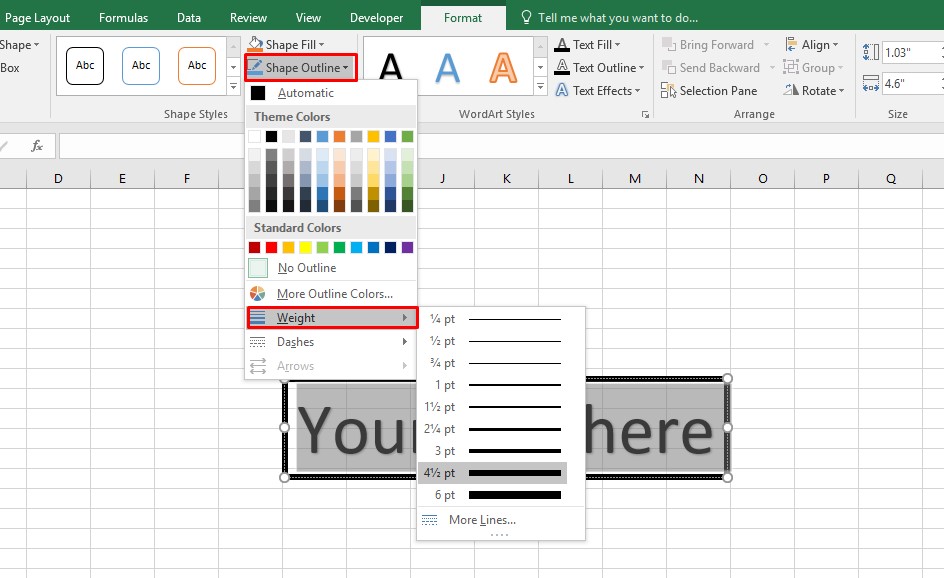
Step-2: Enter the Shape Outline Section
After selecting the desired lines from your Excel graph, you will have to leave the CTRL button. Right after leaving the button, you will have to locate and click on the “Format” tab. As a result, this tab will expand, and you will find an option within this tab named “Shape Outline.”
Inside this section, there will be tools to change the thickness of the Excel graph from your worksheet.
Step-3: Change the Line Thickness in Excel Graph
Then you will need to click on the dropdown icon given on the right side of the “Shape Outline” section. After clicking there, you will see a whole new window for customizing the graph lines in front of you. Scroll down to the later part of this newly opened window until you find the option named “Weight.”
As you take the mouse cursor on this option, you will see different line weight options starting from the lowest to the highest. If the given line weight options don’t fulfill your requirements, there is an alternative. Below those line weight options, there will be another option named “More Lines.”
You can create your required line weight pts to apply in your graph lines. Thus, you can either reduce or increase the line thickness in an Excel graph.
How to Make a Line Graph in Excel
Final Thoughts
The lesson on how to change line thickness in Excel graph is one of the basic lessons of MS Office applications. But that doesn’t mean you should concentrate or focus less on it which can be a real pain during the implementation.
On the contrary, if you do not follow the correct procedure, scenarios will become tougher for you by preventing this action. So, you must learn about the line thickness reducing and increasing of the Excel graphs and charts. Once you are familiar with it through the correct steps, it will become a piece of cake for you to perform.