
Excel is a Microsoft Office application that is basically a spreadsheet program used to save and analyze data in numerical form. It is a common application used by professionals in offices and companies for data reservation. In MS Excel, while preserving and analyzing, a chart plays a vital role in describing the numerical data shortly and clearly.
But as a learner, you might have doubts about how many chart types does Excel offer to work with. There are several types of charts available in MS Excel to showcase data and information in front of others in the simplest possible way.
The Importance of Different Types of Charts in MS Excel
Excel is one of the most used numerical data saving and analyzing platforms because of the easiest interface and functions. However, before learning the importance of charts, it is a must to know what are charts in MS Excel. In MS Excel, charts are often known as graphs used to visual representation of data from a worksheet.
By using the various charts in MS Excel, you will be able to display the necessary information quite simply. These charts are way essential for Excel, and let’s see the reasons behind it:
- The charts help to describe and communicate data graphically
- These various types of charts allow the audience to see the actual meaning behind the numbers that are shown
- Showing comparisons and trends will become way more manageable with the help of the charts given in MS Excel
- You will easily be able to visualize the data sets through charts compared to a table of just rows and numbers
How Many Chart Types Does Excel Offer – Where to Use These Excel Charts
There are several charts type that you can use to simplify the given data and numbers. Some charts are vastly used, and some are used occasionally in MS Excel. Now it is time for taking a quick look at the most used charts present in MS Excel:
- Column Chart
- Pie Chart
- Line Chart
- Scatter Chart or XY Chart
- Bar Chart
- Area Chart
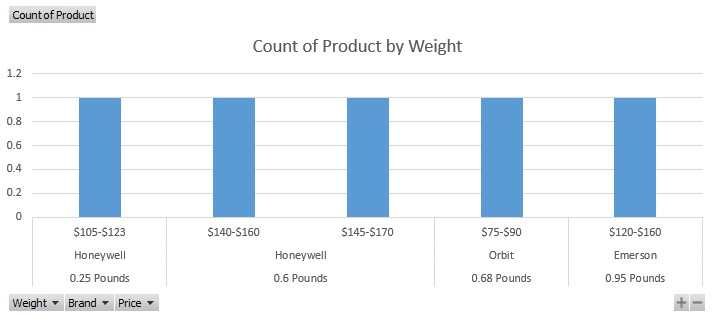
Column Chart
To compare among two or more different things and categories, column charts are necessary. You can create several columns as you want in a column chart per the sections you require. It is also possible to color each of the columns in different colors to establish a clear difference among those.
It will help you understand the changes happened among those when you compare the sections through column charts. There are three types of column charts in Excel, and those are:
- Clustered Column Charts
- Stacked Column Charts
- 100% Stacked Column Charts
Pie Chart
The pie chart is the most used chart type by the general people and professionals worldwide. In this graphical view, you can represent data from your table in a round figure which will define each section’s share. The Pie charts usually indicate only one series of data which is proportional to the sum of all given items.
Based on the view, there are some different types of pie charts available in MS Excel for your usage. The pie charts that you can use on various occasions are:
- General Pie Chart
- 3-D Pie Chart
- Pie of Pie Chart
- Bar of Pie Chart

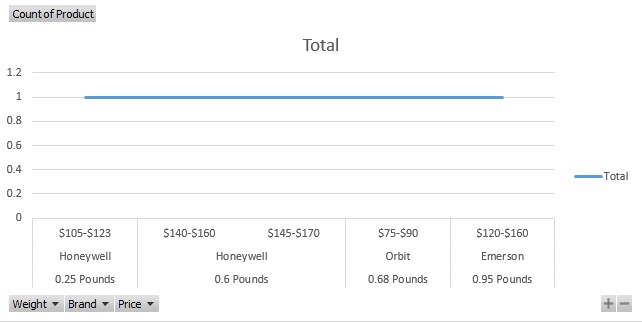
Line Chart
With the help of the line chart, you can showcase continuous data over time, which keeps changing on an evenly scaled axis. The line chart is the most preferred one for displaying trends to make them easily understandable. In a line chart, you can display each section or time in different colors, making it easy to read.
Though it is one of the simplest charts in MS Excel, easy trend showcasing capability makes it a popular choice among users. Like the previous two charts, there are some different types of the line chart, and those are:
- Stacked Line Chart
- 3-D Line Chart
- 100% Stacked Line Chart
- Line with Markers Chart
Scatter Chart or XY Chart
The scatter charts are also vastly known as the XY charts, typically displayed in two different axes. To compare the values of two series over time or another category, you can use this easy-to-define chart. You will have to plot the given data from the table and establish a comparison in the graph.
There are two different scatter or XY charts based on the difference in the line type, and those are:
- Scatter chart with smooth lines
- Scatter chart with straight lines
- Scatter chart with smooth lines and markers
- Scatter chart with straight lines and markers
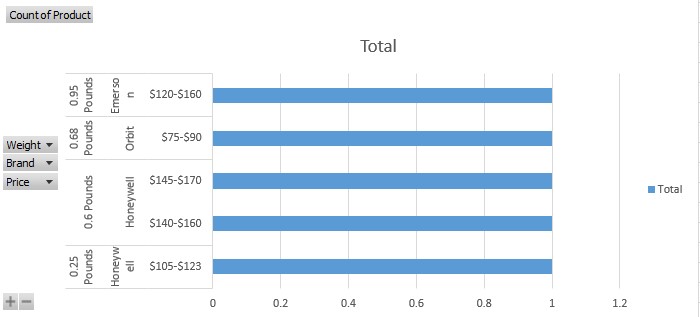
Bar Chart
When you first look at the bar chart, you may think it is a column chart but lying sidewise. In the case of the bar chart, the horizontal axis normally contains the numeric values, which is essential to display and compare a large number of series. Based on the necessity, the bar chart can be represented in both 2-D and 3-D views.
The bar chart has two major sub-sections, and the others are within these two sub-sections. Those two types of bar graph in Excel are:
- Clustered bar chart
- Stacked bar chart
Area Chart
There are similarities between the line charts and the area charts, which can make you think that these are the same. But there is a major difference between these two as the plotline is solid in the area charts compared to the line charts.
The purpose of the area chart is the same as the line chart, which shows trends over time or another category. You can showcase an area chart in both 2-D and 3-D views with X, Y, and Z axes as per the requirement. The major are chart types are:
- Stacked area chart
- 3-D area chart
- 3-D stacked area chart
Excel Quick and Simple Charts
Other Chart Types
The six major chart types are discussed above, but that’s not all as there are some more chart types. Though these charts are not used that vastly, sometimes these charts are a must to apply for describing the numeric values. As a result, it becomes important to learn about these less important charts as well, and those chart types are:
- Doughnut Chart
- Bubble Chart
- Stock Chart
- Surface Chart
- Radar Chart
- Combo Chart
There are sub-sections of these chart types as well, but those sub-sections are rarely used in daily life MS Excel usage.
Read More:
Final Thoughts
Charts are crucial to describe the numeric values in MS Excel to simplify the given data and information. There are a vast number of charts available if you are wondering how many chart types does Excel offers. Some charts are commonly used in almost every scenario, and some are rarely used.
You can apply any of these charts based on the context of the numeric data given in the table. Proper usage of these charts will help the audience to understand the data and information more easily.