EnjoytechlifeEnjoytechlife
  • Home
  • AI
  • Apps
  • Excel
  • Gadget
  • Software
  • Space
  • Word
Facebook Twitter Instagram
  • Privacy Policy
  • Contact Us
  • Sitemap
Facebook Twitter Instagram
EnjoytechlifeEnjoytechlife
  • Home
  • AI

    Removing Life Events on Facebook: A Step-by-Step Guide

    May 4, 2024

    Winning Charms: Unlocking the Mystery of Online Gamers Lucky Rituals

    April 18, 2024

    ทำไมจึงควรเลือกทะเบียนรถจากเว็บออนไลน์ในยุคนี้

    April 9, 2024

    DUNIA303: Tempat Perlindungan Anda bagi Pecinta Slot Online

    March 20, 2024

    Is Each Spin On Megaways Game Unique?

    March 1, 2024
  • Apps

    Cash Advance Apps That Don’t Use Plaid: A Comprehensive Guide

    December 3, 2023

    How to Block Apps on iPhone: A Comprehensive Guide to App Restriction

    December 3, 2023

    Selling Feet Pics Apps: A Comprehensive Guide to Monetizing Your Foot Fetish

    December 3, 2023
  • Excel

    Create Excel Legend Order Not Changing Its Original Copy

    January 28, 2023

    Learn Why Your Microsoft Excel Not Sorting All Columns Duly

    January 3, 2023

    How To Center a Cell Horizontally in Excel

    November 14, 2022

    How To Assign A Value To A Variable In Excel

    November 13, 2022

    How To Shorten Excel Sheet

    November 12, 2022
  • Gadget

    Leasing a MacBook Pro 16″: A Comprehensive Guide

    August 27, 2024

    Exploring Different Safety Mat Types

    August 7, 2024

    Unraveling the Mystery of Dr. Claw in Inspector Gadget: A Comprehensive Exploration

    December 3, 2023
  • Software

    Streamline Your Workforce with the Best Shift Management Software

    April 21, 2025

    Engineering Software in Education: 9 Benefits for Students and Educators

    March 27, 2024

    How Can a CRM Add Value to Your Organization

    March 25, 2024

    Best Practices in AI Software Development: Your Guide to Success with a Custom Software Development Company

    March 15, 2024

    Is SAS Faster Than SSD?

    February 13, 2024
  • Space

    Unveiling the Enchantment: Explore the Wonders of the Museum of Dream Space

    December 3, 2023

    Plan 9 from Outer Space: Unraveling the Mystery of the Cult Classic

    December 3, 2023

    Trials in Tainted Space Wiki: Unraveling the Galactic Adventures

    December 3, 2023

    Power Rangers in Space: Exploring the Galactic Adventures of the Legendary Heroes

    December 3, 2023
  • Word

    How to Split Pages in Word into Separate Files

    June 20, 2023

    How do I Delete a page in Word that won’t Delete Mac

    May 28, 2023

    How To Get Rid Of Footer In Word

    April 23, 2023

    How to Merge Multiple Pages into One Page in Word? A Complete Guide

    January 2, 2023

    How To Print Gridlines in Word

    December 7, 2022
EnjoytechlifeEnjoytechlife
Home»Excel»Excel Trendline Equation in Cell
Excel

Excel Trendline Equation in Cell

By RodneyFebruary 11, 2022Updated:February 11, 20224 Mins Read
Facebook Twitter LinkedIn Telegram Pinterest Tumblr Reddit Email
Excel Trendline Equation in Cell
Share
Facebook Twitter LinkedIn Pinterest Email

It’s common to want to see the overall pattern of your data when making a chart out of it. Newer versions of Excel have made it quite simple to create a trend line. There is only one true challenge regarding trendlines: deciding which form of the trendline is ideal for your data. This article will expedite the process of creating an Excel trendline equation in cell.

Excel Trendline

A trendline is a linear or bent arc in a graph that depicts the main pattern or flow of the information. Commonly used to represent data flow over a period or relationship between two parameters.

A trendline resembles a line chart; however, it does not link the datasets like a line graph. Statistical mistakes and small outliers are ignored while drawing a best-fit line, which depicts the overall trend across all data. It may be used to foresee trends in particular instances.

Excel Trendline Types

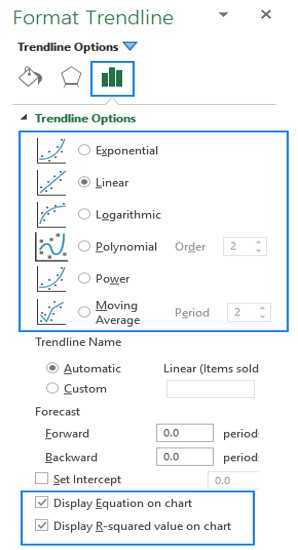
In Excel, there are six ways to generate a trendline. It’s possible to present an equation and R-squared value for trends in a chart using Microsoft Excel:

  • The trendline equation calculates the optimum line to suit the datasets.
  • The trendline’s validity is measured by R2 – the closer it is to 1, the finer.
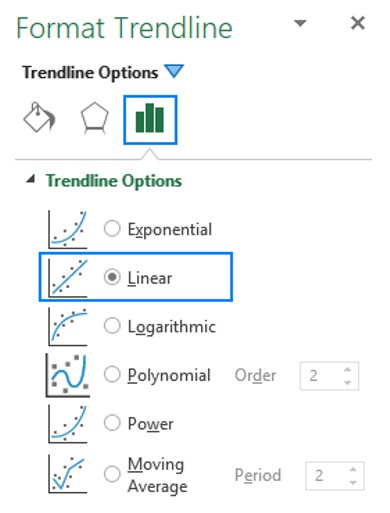
Excel Trendline Types

Linear

Using a linear trend line is useful when the data sets in a graph seem like straight lines. In most cases, a linear trendline depicts an upward or downward movement that is constant across time.

Exponential

You can see how datasets climb or decrease at a rising pace; thus, the line is generally more bent on one direction. Science makes frequent use of this trendline form to depict the rise or fall of human populations or wildlife species.

Please bear in mind that an exponential trendline can’t be constructed for input that includes zeros or negative figures.

Logarithmic

In most cases, the logarithmic best-fit arc is applied to depict data that climbs or drops rapidly before stabilizing at some point. Negative values may also be included in this.

Polynomial

Large amounts of data with fluctuating readings with more than one highs and lows are best served by the polynomial curvilinear trendline.

An exponent’s degree is used to categorize polynomials. Additionally, the number of curves in the polynomial trendline may be used to gauge its strength. Quadratic polynomial trendlines have one curve, cubic polynomial trendlines have one or two curves, and quartic polynomial trendlines have up to three bends.

If you want to add a polynomial trendline to a chart in Excel, you may do so by entering the degree value in the Order field in the Format Trendline panel, which is two by convention.

Power

The exponential arc and the power pattern line are similar, but the power trend has a better symmetrical contour. Readings that rise at a set pace are often plotted using this technique. Excel charts with zero or negative numbers cannot have a power trendline applied to them.

Moving average

Using a moving average trendline might help you vividly observe patterns when your datasets contain a lot of volatility. A moving average of two periods is calculated by Excel and used as a starting point for a line in your graph. In general, a smoother line may be achieved by increasing the Period value.

Process of Including a Trendline in an Excel Spreadsheet

A trend line may be easily added to Excel 2019, Excel 2016, and Excel 2013 using a simple three-step procedure:

  1. Choose it by clicking anywhere on the graph.
  2. Tap the Chart Elements key (the cross button) on the right corner of the graph, and afterward perform any of the following:
  1. Select the Trendline checkbox to input the standard linear trendline:
standard linear
  • Pick a proposed trendline by clicking the arrow beside it:
Linear
  • Select More Options by clicking the arrow beside Trendline. Selecting this item will bring up the Format Trendline window, where you may select the trend line style of your choice from the Trendline Options menu. Linear trendlines are the standard, and the trendline equation may also be shown in the graph as an alternative.
Linear trendlines

The Add Trendline option may be accessed by right-clicking the set of data in the Excel graph and selecting the trendline.

How to Forecast & use Trendlines in Microsoft Excel

Conclusion

Knowing how to utilize the many beneficial components of Microsoft Excel is quite essential and may be of use to anyone in any career, regardless of their background. You may sort and organize data pretty quickly and simply using a variety of commands and keyboard shortcuts, and it is even feasible to construct a trend based on the results of your data. Hopefully, this post on Excel Trendline equation in cell will assist you in learning more about trendlines and how to use them in your projects.

Share. Facebook Twitter Pinterest LinkedIn Tumblr Email
Previous ArticleSSD Showing Up in BIOS But Not Windows
Next Article How To Find Special Characters in Excel
Rodney

Related Posts

Create Excel Legend Order Not Changing Its Original Copy

January 28, 2023

Learn Why Your Microsoft Excel Not Sorting All Columns Duly

January 3, 2023

How To Center a Cell Horizontally in Excel

November 14, 2022

How To Assign A Value To A Variable In Excel

November 13, 2022

How To Shorten Excel Sheet

November 12, 2022

How Do You Add Variables in Excel?

November 7, 2022

Leave A Reply Cancel Reply

Popular Now

Metal Oxide Surge Arresters in Railway Protection

May 2, 2025

A Complete Home Improvement Guide to Elevate Aesthetics

May 1, 2025

Natural Stone Coping and Paving Combinations for Outdoor Spaces in 2025

April 28, 2025

Door Repair Techniques and Common Faults in New York Apartments

April 28, 2025

The Tipping Point of Data Security: Why Hard Disk Disposal Changes Everything

April 25, 2025
About Us

Enjoytechlife is a technology blog. I am passionate with technology for this reason start this blog to share my view and knowledge with people who are interested in tech. Enjoytechlife!

For Any Inquiries

Contact : [email protected]

Top Picks
Tech

Metal Oxide Surge Arresters in Railway Protection

By RodneyMay 2, 2025
Follow Us
  • Facebook
  • Twitter
  • Pinterest
  • Instagram
  • YouTube
  • LinkedIn
Facebook Twitter Instagram Pinterest
  • Privacy Policy
  • Contact Us
  • Sitemap
Enjoytechlife.com © 2025 All Right Reserved

Type above and press Enter to search. Press Esc to cancel.